

Most nonprofit websites are flying blind.
They know donations are coming in because the bank account reflects it. They know the website is up because nobody has called to say it's down. But they don't know which pages are converting, which traffic sources are producing actual donors, where people are dropping off mid-flow, or whether this month's performance is better or worse than last month's on any dimension that matters.
That's a solvable problem. And solving it costs nothing except time.
This guide walks through exactly how to set up donation conversion tracking for a nonprofit website, in the right order, with the right tools, so that every design and strategy decision you make going forward is grounded in evidence rather than intuition.
Why Tracking Matters Before Anything Else
Before we get into the how, it's worth being clear about why this matters so much.
At WANDR, analytics setup is non-negotiable on every project. It's not optional, it's not a nice-to-have, and it's not something we configure after launch. We set it up before the site goes live because the data from the first days and weeks of a new experience is some of the most valuable you'll ever have.
Here's why: when a new visitor encounters your site for the first time, their behavior is uncontaminated by familiarity. They can't find the donation page because they don't know where to look. They abandon the form because something in it felt wrong. They came from a search query you didn't expect and landed on a page that wasn't optimized for them. All of that is information, and it's available to you only if you're tracking it.
Without tracking, you make changes based on internal opinion. With tracking, you make changes based on what real users actually did.
The organizations that improve their conversion rates over time do it because they can see what's not working and change it. The organizations that stay stuck are the ones that launched without measurement and are still guessing.
The Analytics Stack: What to Set Up and in What Order
There's a specific sequence that matters here, and it's different from what many people assume.
Step 1: Google Search Console
Start here, not with Google Analytics.
Search Console tells you how your site performs in Google Search specifically: which queries are triggering your pages to appear, how many people see those results (impressions), how many click through (clicks), and your average position for each query.
This is your SEO foundation. It shows you what organic search traffic is finding your nonprofit, which pages people are landing on from search, and which terms you're already ranking for that could be better optimized.
For donation tracking specifically, Search Console tells you whether people are finding your donation-related pages through search at all, and if so, what they're searching when they do. This shapes your content strategy: if nobody is finding your donation page organically, you need either better SEO on those pages or more content targeting the queries that lead to giving intent.
Set up: go to search.google.com/search-console, add your property, verify ownership, and submit your sitemap. Start reviewing data after your first 30 days of traffic.
What to review monthly: top queries driving traffic to your site, top landing pages from search, pages with high impressions but low click-through rates (these need better title tags and meta descriptions), and any coverage errors (pages not being indexed).
Step 2: Google Analytics 4
Once Search Console is running, set up GA4 for full traffic and behavior analysis.
GA4 is your primary behavioral analytics platform. It shows you where your traffic comes from (organic search, social media, email, direct, referral, paid), what people do when they arrive (which pages they visit, in what order, for how long), and, critically, whether they complete the actions that matter.
For donation tracking, GA4 needs to be configured with conversion events. Out of the box, GA4 tracks pageviews and some basic engagement metrics, but it won't automatically know that a user completing your donation form is a more important event than a user visiting your About page. You have to tell it.
Conversion events to configure:
- Donation form view: tracks every time someone reaches your donation form (tells you how many people reach the step)
- Donation form started: tracks when someone begins filling out the form (tells you engagement vs just viewing)
- Donation completed: tracks when someone reaches the confirmation page after a successful donation (the most important event)
- Recurring giving enrollment: if distinct from one-time donation completion, track separately
- Newsletter sign-up: secondary conversion but important for long-term donor pipeline
- Volunteer application submitted: if volunteer recruitment is a primary goal
How to configure in GA4: go to Admin > Events > Create Event, or work with your donation platform's GA4 integration documentation. Most major platforms (Fundraise Up, Donorbox, Give Butter) have GA4 integration guides that walk through event setup.
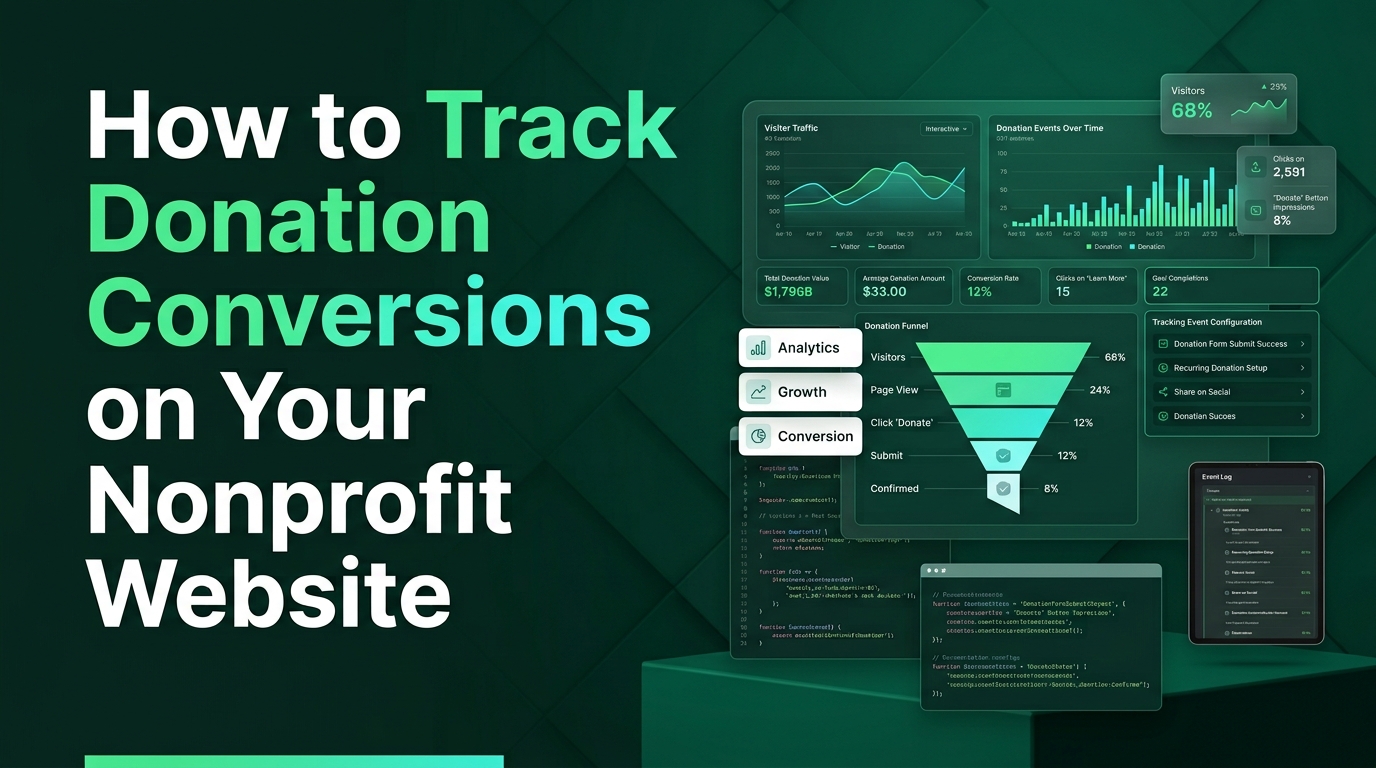
The funnel report: once conversion events are configured, build a funnel exploration in GA4 that shows how many users progress through each step of your donation flow. Donation page view > form started > payment entered > confirmation reached. The drop-off between each step is where your conversion problems live.
Traffic source attribution: in GA4, go to Acquisition > Traffic Acquisition to see which channels are driving conversions, not just visits. You may find that email drives a higher conversion rate than social, or that organic search produces your highest-value donors. That information should directly influence where you invest your time and budget.
Step 3: Donation Platform Analytics
Most modern donation platforms (Fundraise Up, Give Butter, Donorbox, Classy) have their own analytics dashboards that complement GA4 with platform-specific data. WANDR has built inside this layer directly: we designed and developed the donor-facing flow for GiveSmart, a leading mobile fundraising and auction platform, which is where much of this platform-side data originates.
Your donation platform analytics will typically show you: total donation volume by time period, average gift size, recurring vs one-time split, top-performing campaigns, and donor retention metrics.
The combination of GA4 (which tells you how people get to your donation pages and what they do on your site) and donation platform analytics (which tells you what happens once they're in the giving flow) gives you a complete picture.
Cross-reference the two: if GA4 shows 500 donation form views per month and your donation platform shows 50 completions, your conversion rate is 10%. If your form had 500 views and the platform shows 20 completions, that's 4%, and you have a clear priority.
Step 4: Heatmapping (After, Not Before, Redesign)
We want to be direct about the sequencing here because it matters.
Heatmapping tools (Hotjar, Microsoft Clarity, Mouseflow) show you where users click, scroll, and move their attention on specific pages. They're genuinely useful for identifying specific friction points in your donation flow or on high-traffic pages.
But here's the issue: if your website is overdue for a redesign, heatmap data from your current site tells you how users navigate something you're about to replace. That's not useful data. You'd be optimizing for a design that shouldn't exist.
Heatmapping is most valuable after a redesign is complete and you're working to optimize the experience you've already built. Post-redesign heatmaps tell you whether users are seeing the CTA you designed for them to see, whether they're scrolling past the impact statement before deciding, whether the donation button is in the right place.
Use heatmapping as a continuous improvement tool for a site that's already strategically sound, not as a diagnostic for a site that needs to be rebuilt.
Reading Your Data: What to Look For
Once tracking is in place, the question becomes what to do with the data. Here's a practical monthly review framework.
From Search Console:
- Which queries drove the most clicks this month? Are any of these donation-related terms?
- Which pages have the highest impressions but the lowest click-through rates? These need better title tags.
- Are there any coverage errors or pages that lost significant ranking?
From GA4:
- What's the conversion rate on the donation page this month vs last month?
- Which traffic sources produced the most donation completions?
- Where in the donation funnel are people dropping off most?
- Which pages have the highest bounce rate? (High bounce rate on your donation page specifically is a red flag.)
- What's the time-to-conversion for organic search visitors vs direct visitors? (This tells you about the quality of different audience segments.)
From donation platform:
- What's the average gift size this month vs last month?
- What percentage of new donors are choosing recurring giving?
- What's the repeat donation rate from existing donors?
Review these monthly. Note the trends. When something changes significantly (conversion rate drops, a traffic source suddenly becomes a top performer, a page loses significant impressions), investigate before assuming it'll resolve on its own.
The Most Common Analytics Mistakes We See
Not setting up conversion events. Without configured conversion events, GA4 only tells you about traffic, not about outcomes. The most important data point on a nonprofit website is "how many people completed a donation" and GA4 won't show you that without explicit configuration.
Looking at pageviews without context. 10,000 pageviews means nothing without knowing the conversion rate. A page with 500 views and a 5% conversion rate is worth more than a page with 10,000 views and a 0.1% conversion rate.
Ignoring Search Console. Many nonprofits set up GA4 and never look at Search Console. But for organizations where organic search is a meaningful traffic source, Search Console data is irreplaceable for understanding which queries are bringing in supporters and where the SEO gaps are.
Reviewing data without acting on it. Analytics is only valuable if it changes decisions. If you review the monthly dashboard and nothing changes about how you manage the site, you're spending time without gaining value. Every review session should produce at least one action item.
Setting up heatmaps before fixing the fundamentals. Heatmap data on a site with broken donation flows, poor SEO, and no conversion tracking is a distraction. Fix the infrastructure first.
A Real Example: What Analytics Revealed
The analytics setup WANDR implemented for WWF Canada post-redesign revealed something immediately useful: a segment of visitors arriving through organic search on specific wildlife protection queries was converting to donations at a significantly higher rate than the average site visitor.
That's information. It means that content targeting those queries is producing high-value donor traffic, and that investing in more content around those topics (or better optimization of existing pages) would produce more donors from the same organic search channel.
Without analytics configured from day one, that insight would have taken months to surface, if it surfaced at all.
This is why we treat analytics as infrastructure, not reporting. It's not a dashboard you check when someone asks about it. It's the feedback loop that makes every future decision better.
Getting Help
If setting this up feels overwhelming, or if you've attempted it and aren't confident the tracking is working correctly, professional audit and setup is worth the investment.
At WANDR, analytics configuration is part of every engagement. We set it up before launch, test that every conversion event is firing correctly, and include three months of post-launch review where we walk clients through what the data is showing and what to do about it.
If you already have a site but you're not confident your tracking is set up right, a standalone analytics audit can identify the gaps and fix them quickly.
Book a free nonprofit website diagnostic to talk through what your current tracking setup looks like and where the gaps are.
WANDR Studio is a woman-owned design, development, and strategy agency specializing in nonprofit digital experiences. We've generated $3.2M+ in additional donations across 15+ nonprofit engagements.
Related reading: How to Do a Nonprofit Website SEO Audit | Nonprofit Website SEO: How to Get Found Without a Big Ad Budget | Nonprofit Website Best Practices
Related WANDR case studies: WWF-Canada · Mercy For Animals · DonateHello
Planning a nonprofit website project? Explore WANDR's nonprofit web design services →